The Center for Health Effects of Environmental Contamination (CHEEC) at the University of Iowa is partnering with Watershed Management Authorities (WMAs) across eastern Iowa to enhance water quality monitoring and better understand the presence of environmental contaminants in the state’s surface waters.
Through this collaborative effort, volunteers and conservation staff are collecting water samples from five major watersheds: Middle Cedar, Upper Wapsipinicon, Turkey, Upper Iowa, and Maquoketa. These samples are analyzed at the University of Iowa for key indicators of water quality, including nitrate, phosphate, chloride, E. coli, and total suspended solids (TSS).
CHEEC has expanded its analytical scope to include pesticides (neonicotinoids), per- and polyfluoroalkyl substances (PFAS), and metals, providing a more comprehensive view of contaminant distribution across Iowa’s waterways.
Understanding Iowa’s Watersheds
Each watershed presents unique characteristics in terms of size, population, agricultural activity, and livestock density. For example, the Middle Cedar watershed has the highest percentage of row crops (74.3%) and the largest population (~300,000), while the Turkey watershed leads in livestock density with over 338,000 animal units.
Sampling sites, selected by WMAs, include both main stems and tributaries. Sampling occurs monthly or biweekly from April through October, with core parameters measured consistently across sites.
Key Findings from 2024
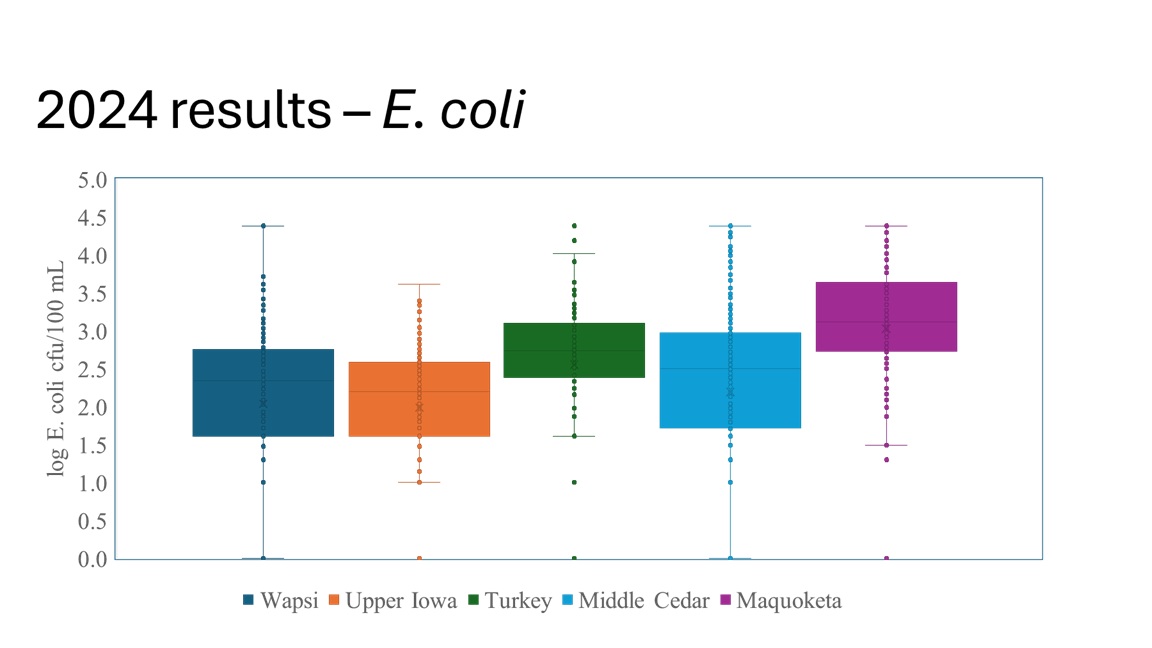
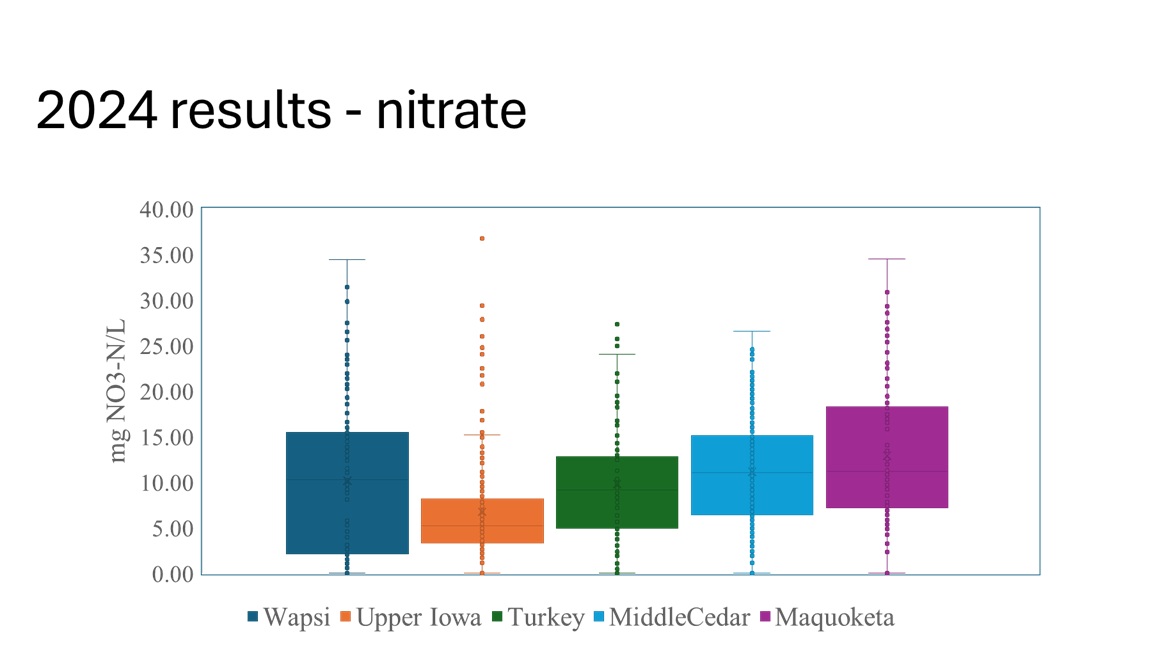
- Nitrate & E. coli: Elevated nitrate levels were found in watersheds with intensive row cropping. E. coli concentrations varied seasonally and spatially, indicating potential sources of fecal contamination.
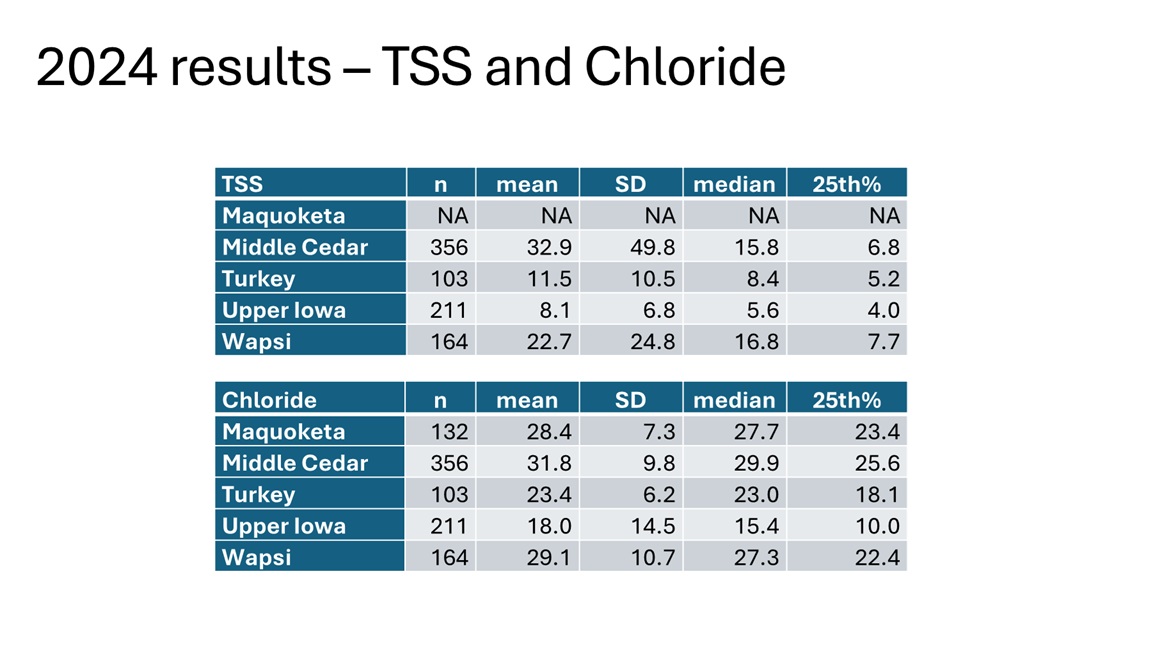
- TSS & Chloride: The Middle Cedar watershed recorded the highest TSS levels (mean: 32.9 mg/L). Elevated chloride concentrations were observed in both Middle Cedar and Maquoketa, likely linked to urban runoff or wastewater discharge.
- PFAS: PFBA was the most frequently detected PFAS compound, appearing in 30 samples with a maximum concentration of 4.65 ng/L. A sample from the Mississippi River showed 26.3 ng/L. Due to consistently low concentrations, PFAS sampling was discontinued in July.
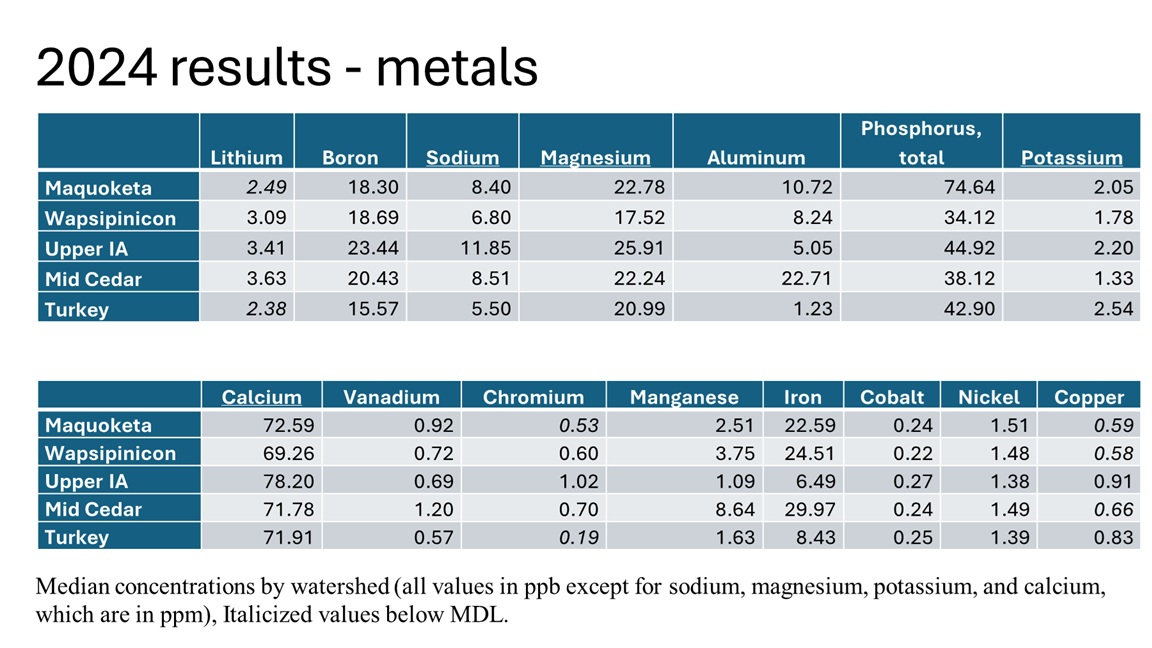
- Metals: Iron, manganese, aluminum, and phosphorus were measured across all watersheds, with most concentrations falling within expected ranges. Some correlations were noted between TSS and metal levels.
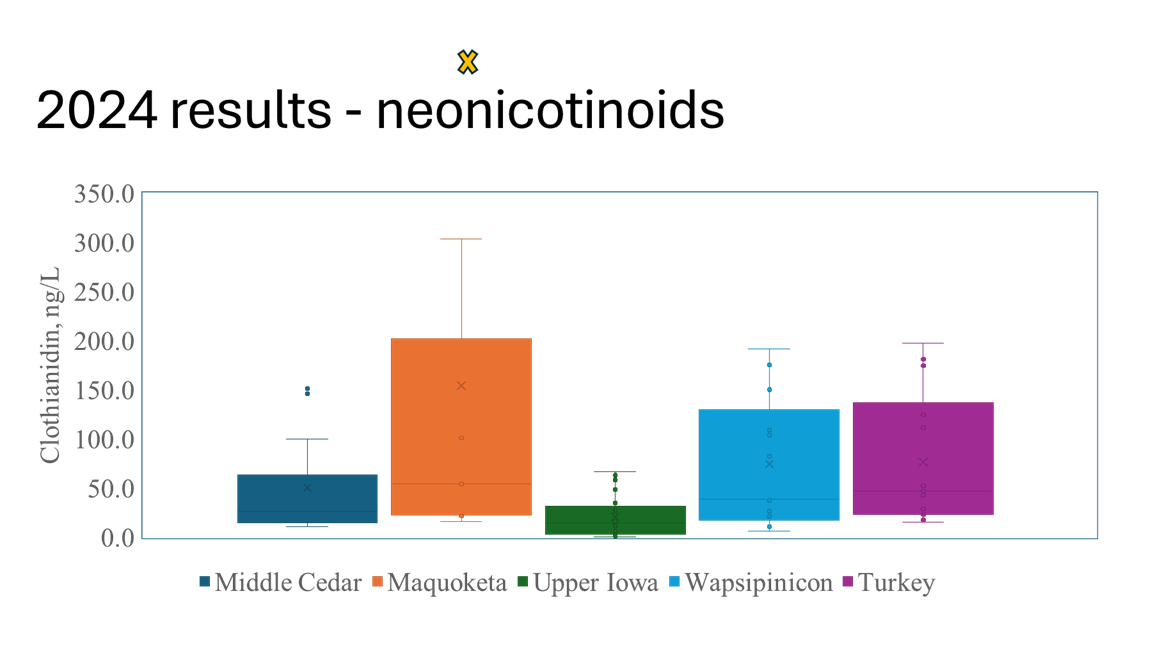
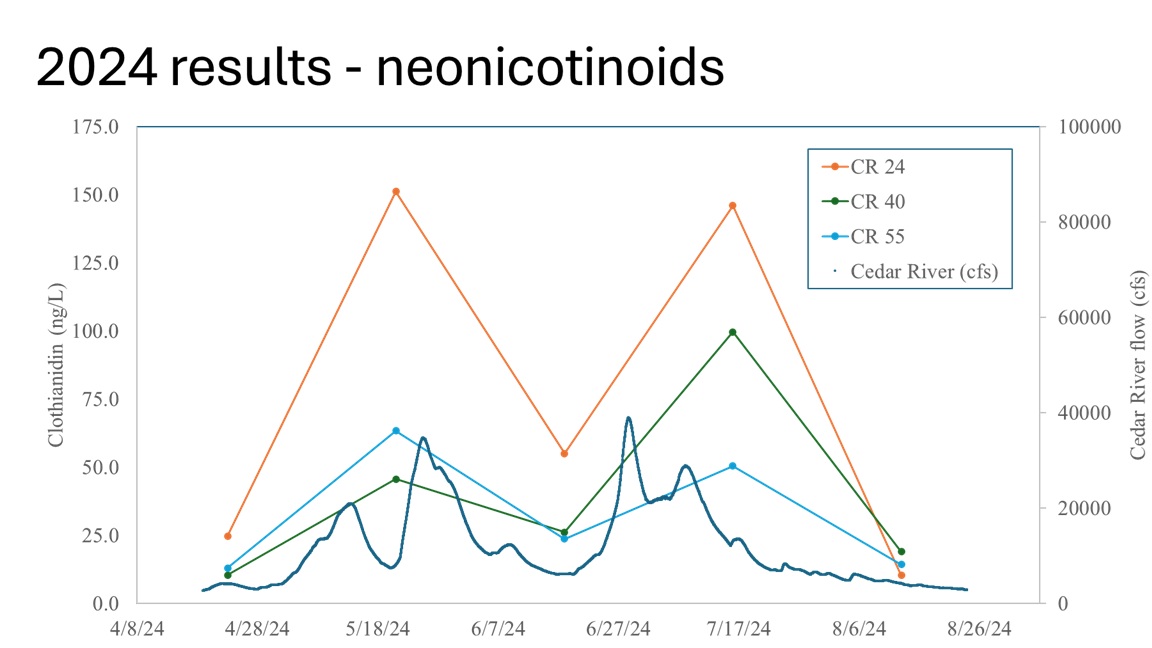
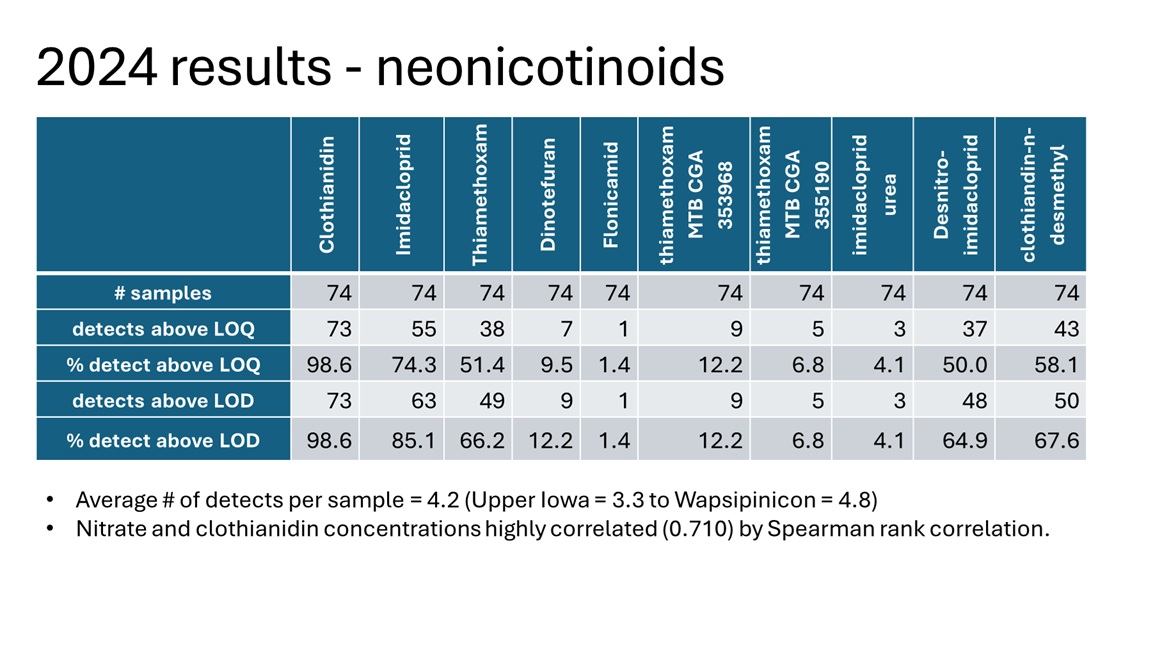
- Neonicotinoids: An average of 4.2 neonicotinoid detections per sample was recorded, with the Wapsipinicon watershed showing the highest average (4.8). Clothianidin was detected in 98.6% of samples above the limit of quantification. A strong correlation (Spearman ρ = 0.710) between nitrate and clothianidin suggests agricultural sources.